Resource Links
The Division of Traffic Engineering is charged with designing streets for safe and efficient traffic operation.
The Division erects and maintains traffic control devices, prepares drawings, standards, and specifications, and determines both parking and the design/placement of pavement markings, traffic signs, and traffic control devices.

Traffic Signals
216.420.8273
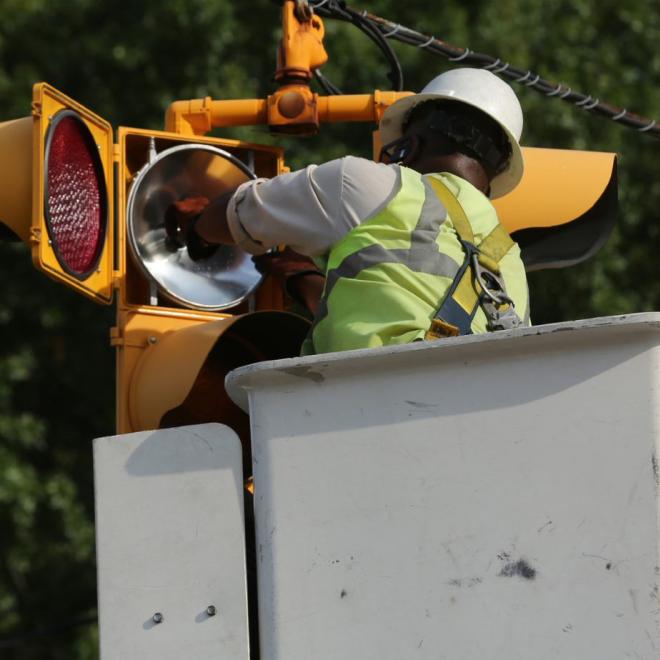
This program allows for the installation, maintenance, and repair of traffic signals and related aspects. This work is performed in a timely manner, as new and revised installations are made within four (4) months, with complete repairs completed within two (2) months for non-emergencies and immediately for emergencies.

Traffic Signing and Street Marking
216.420.8282
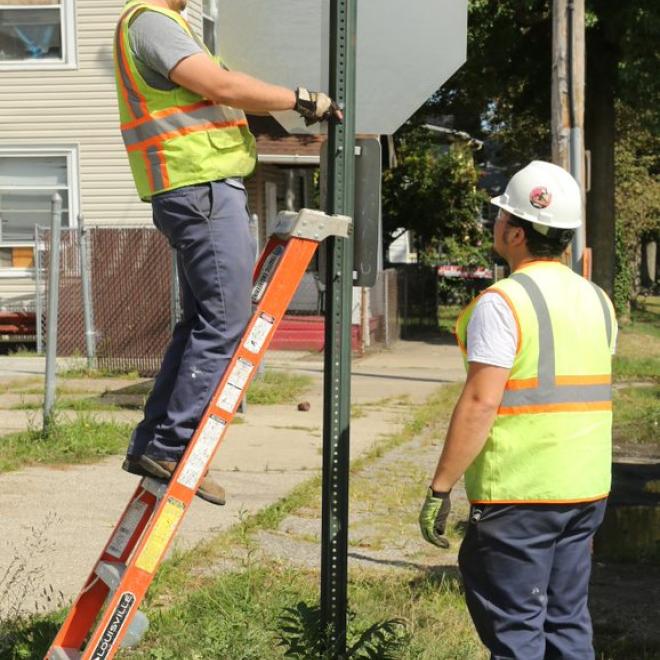
This program allows for the fabrication, installation, maintenance, and replacement of traffic, parking, and miscellaneous signs, and traffic markings, along with the fabrication and installation of special signs for other City organizations.
Traffic Calming
In the summer of 2022, the City of Cleveland launched a residential speed table pilot program to inform a future citywide traffic calming policy. The City will also be deploying radar speed feedback signs to raise awareness of speeding on residential streets.
Traffic calming refers to street design solutions that slow vehicle speeds, making streets safer for all road users.
Speed tables are vertical bumps in the road that cause drivers to slow down to drive over them. Speed tables are flat on the top and are not as abrupt as speed bumps, which are narrower and rounded.
Radar speed feedback signs are posted near speed limit signs and show the travel speeds of passing vehicles to increase drivers' attention and awareness.
Traffic Calming Goals
- Increase quality of life for residents by creating safer, calmer streets
- Reduce the chance of serious injury or death if a crash does happen
- Expand local experience with street design interventions that reinforce lower speeds in residential areas
- Inform citywide traffic calming programs and guidance in alignment with the Vision Zero Cleveland initiative
Pilot Objectives
- Use removable, modular rubber speed tables at nine (9) locations across the City to document the impact of speed tables on vehicle speeds
- Investigate the feasibility, cost, and effectiveness of a City-installed asphalt speed hump at one (1) location
- Address any service delivery challenges experienced by Public Safety, Public Works, or the Greater Cleveland Regional Transit Authority
- Document the effectiveness of radar speed feedback signs in addressing residential speeding
- Collect resident feedback to inform a citywide approach
Location Criteria
The neighborhood speed table pilot targets local, primarily residential streets with medium traffic volumes and documented speeding issues. Eligibility is determined by:
- Average daily traffic of 1,000 to 4,000 vehicles
- Average speeds at or above the posted speed limit
- 85th percentile speeds at 6 mph or over the posted speed limit
Additional prioritization factors may include documented crash history and the presence of schools, parks, or other bicyclist/pedestrian demand generators.
Seven (7) local streets with lower traffic volume received 10.5-foot-wide speed tables, with a target design speed of 15 miles per hour.
Neighborhood collectors in two (2) pilot locations (including one along a transit route) received 14-foot-wide speed tables, with a target design speed of 20 miles per hour.
Speed Table Pilot Locations
- Edgewater Drive between W. 117th and W. 115th
- West 101st Street between Madison Avenue and N Marginal Drive
- West 56th Street between Denison Avenue and Eichorn Avenue
- West 50th Street between Kouba Avenue and Clark Avenue
- Bohn Road between East 40th Street and Kennard Road
- Dickens Avenue between Larry Doby Way and East 116th Street
- Corlett Avenue between East 120th Street and East 127th Street
- East 147th Street between Bartlett Avenue and Glendale Avenue
- Judson Drive between East 151st Street and East 160th Street
- East 174th Street between Ozark Avenue and Nottingham Road
Pilot Evaluation and Results
The City collected data from a variety of sources to measure the pilot program's effectiveness and to inform a citywide traffic calming policy.
| Project Objective | Evaluation Metric | Measure of Success |
|---|---|---|
| Document effectiveness of speed tables. | Pre- and post-speed and volumes on pilot streets | Achieve 85th percentile speeds at or below the posted speed limit. |
| Pre- and post-speed and volumes on adjacent parallel streets | No significant impact on speeds or volumes of adjacent streets | |
| Pre- and post-crash data review on pilot streets | No significant increase in crash severity on pilot streets | |
| Address service delivery challenges, if any. | Qualitative interviews with Public Safety, Public Works, and GCRTA personnel | Insignificant or acceptable levels of service impact due to presence of speed tables |
| Use resident feedback to refine approach. | Feelings of safety, program approval, and qualitative feedback gathered via survey | Documented resident approval based on increased feelings of roadway safety |
| Investigate potential for City-installed asphalt speed tables. | Installation time, cost, and durability | Cost-effective and maintainable, with no significant difference in effectiveness compared to modular installations |
| Measure impacts of radar speed feedback signs (rotating locations) | Speeds and volumes prior to sign installation, while sign is installed, and following sign removal | Speed reductions when signage is present; speed reductions following signage removal |